Part 3: Modern Frontend with 3D Map and Live Panel
Learn how to build a high-performance 3D asset tracking dashboard using Angular and Cesium.js. Featuring real-time SignalR integration, dynamic 3D models, and geofence alerting.
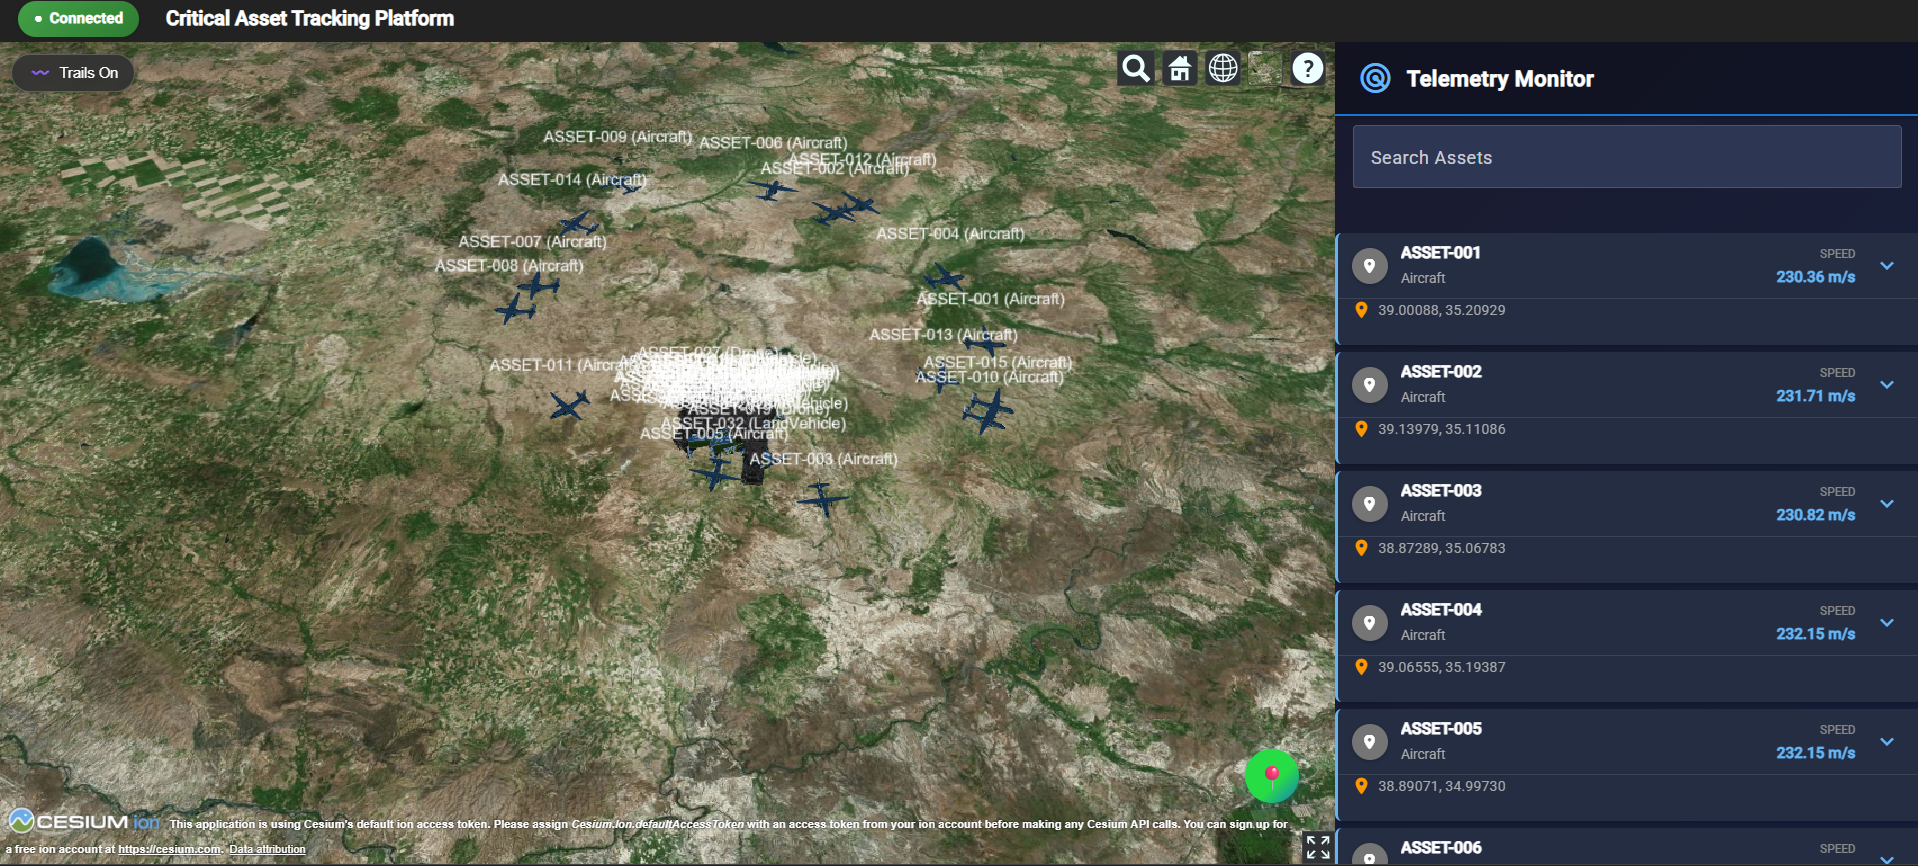
Modern Frontend with 3D Map and Live Panel
Angular & Cesium for Real-Time Asset Tracking on a 3D Map
In previous parts, we built a simulator and backend API. Now we'll visualize everything with Angular and Cesium.js for real-time 3D asset tracking.
Key Features
- Real-Time Updates: SignalR connection for live telemetry
- 3D Visualization: Cesium renders assets with dynamic models and trails
- Modern UI: Card-based panel with color-coded badges
- Geofence Management: Draw boundaries and get instant alerts
- Responsive Design: Works on desktop and mobile
Architecture
src/app/
├── components/
│   ├── cesium-map/              # 3D map with Cesium
│   ├── connection-status-badge/ # Connection indicator
│   ├── geofence-alert/          # Violation alerts
│   └── telemetry-panel/         # Live asset cards
├── services/
│   ├── signalr.service.ts       # WebSocket connection
│   └── geofence.service.ts      # Boundary logic
├── models/
│   ├── telemetry-point.model.ts
│   └── geofence.model.ts
├── enums/
├── helpers/
└── utilities/
SignalR Connection
The SignalRService handles real-time updates:
export class SignalRService {
  async startConnection(url: string): Promise<void> {
    this.hubConnection = new signalR.HubConnectionBuilder()
      .withUrl(url)
      .withAutomaticReconnect()
      .build();

    this.hubConnection.on('ReceiveTelemetry', (data: TelemetryPoint) => {
      this.telemetrySubject.next(data);
    });

    await this.hubConnection.start();
  }
}
How it works:
- Establishes WebSocket connection to backend
- Automatically reconnects on connection loss
- Listens for
ReceiveTelemetryevents - Broadcasts updates to all subscribers via RxJS Subject
3D Map with Cesium
The CesiumMapComponent renders assets in 3D with:
- Dynamic Models: Different 3D models for aircraft, drones, vehicles
- Trails: Visual path history
- Orientation: Assets rotate based on heading/pitch/roll
- Geofence Drawing: Click to create boundaries
Creating Entities
viewer.entities.add({
  id: pt.assetId,
  position,
  orientation: new Cesium.ConstantProperty(orientation),
  model: {
    uri: CesiumUtility.getModelUri(pt.assetType),
    scale: 2,
    minimumPixelSize: 64
  },
  polyline: {
    positions: this._trails.get(pt.assetId),
    width: 2,
    material: CesiumUtility.getTrailColor(pt.assetType)
  }
});
Key Components:
position: Geographic coordinates (latitude, longitude, altitude)orientation: 3D rotation based on heading, pitch, rollmodel: 3D GLB model file for visual representationpolyline: Trail showing asset's movement history
Performance
Updates are throttled to 100ms intervals for smooth rendering even with 45+ concurrent assets.
Telemetry Panel
The TelemetryPanelComponent displays assets in expandable cards:
- Color-Coded Badges: Blue (aircraft), orange (drone), green (vehicle)
- Material Icons: Visual asset type indicators
- Click to Zoom: Selecting a card zooms the map to that asset
- Smooth Animations: 225ms transitions
<div class="asset-card" (click)="toggleRow(asset)">
  <div class="asset-type-badge" [style.background]="getAssetTypeColor(asset.raw?.assetType)">
    <mat-icon>{{ getAssetTypeIcon(asset.raw?.assetType) }}</mat-icon>
  </div>
  <div class="asset-id">{{ asset.id }}</div>
  <span class="metric-value">{{ asset.speed }} m/s</span>
</div>
Features:
- Real-time metric updates (speed, altitude, heading)
- Expandable details view
- Last update timestamp
- Smooth card animations
Geofence Management
The GeofenceService enables boundary monitoring:
- Click Draw Geofence button
- Click points on the map
- Double-click to finish
- Get instant alerts on entry/exit violations
checkGeofenceViolations(assetId: string, point: TelemetryPoint): GeofenceViolation[] {
  this.geofences.forEach(geofence => {
    const isInside = this._isPointInPolygon(point, geofence.polygon);
    const wasInside = this.assetStates.get(assetId)?.get(geofence.id) ?? false;

    if (isInside && !wasInside && geofence.alertOnEntry) {
      violations.push({ type: 'ENTRY', geofenceId: geofence.id });
    }
  });
}
Violation Detection:
- Uses point-in-polygon algorithm
- Tracks previous asset states
- Detects both entry and exit events
- Configurable alert types per geofence
The GeofenceAlertComponent shows blinking notifications with sound alerts that auto-dismiss after 15 seconds.
User Experience
- Connection Badge: Shows SignalR status (connected/disconnected/reconnecting)
- Trail Toggle: Show/hide asset paths
- Auto Zoom: Map automatically fits all assets on first load
- Responsive: Panel collapses on mobile devices
Configuration
Edit environment.ts:
export const environment = {
  production: false,
  signalRHubUrl: 'http://localhost:5073/hubs/telemetry',
  cesiumBaseUrl: 'assets/cesium',
  cesiumIonToken: '' // Optional
};
Configuration Options:
signalRHubUrl: Backend SignalR hub endpointcesiumBaseUrl: Path to Cesium library assetscesiumIonToken: Optional token for Cesium Ion services (better terrain, imagery)
Running
Docker (Recommended)
cd backend
docker compose up --buildLocal Development
cd frontend/critical-asset-frontend
npm install
npm startCustomization
Add Asset Types
In CesiumUtility:
public static getModelUri(type?: AssetType): string {
  const models: Record<AssetType, string> = {
    [AssetType.Aircraft]: 'assets/models/Cesium_Air.glb',
    [AssetType.Drone]: 'assets/models/drone.glb',
    [AssetType.Vehicle]: 'assets/models/GroundVehicle.glb',
    [AssetType.YourNewType]: 'assets/models/YourModel.glb'
  };
  return models[type ?? AssetType.Aircraft];
}
Adjust Throttling
private _updateThrottleMs = 100; // Lower = more updates, higher CPU usageCustomize Colors
public static getAssetTypeColor(type?: AssetType): string {
  const colors: Record<AssetType, string> = {
    [AssetType.Aircraft]: '#2196F3',  // Blue
    [AssetType.Drone]: '#FF9800',     // Orange
    [AssetType.Vehicle]: '#4CAF50'    // Green
  };
}
Conclusion
The frontend combines Angular's component architecture with Cesium's 3D rendering for a powerful real-time monitoring dashboard. SignalR ensures live updates, while throttling and optimization maintain smooth performance with dozens of concurrent assets.
Key Takeaways
- SignalR provides WebSocket-based real-time updates
- Cesium renders 3D assets with trails and orientation
- Card-based UI improves readability and interaction
- Geofence alerts enable proactive monitoring
- Optimizations ensure 60 FPS with 45+ assets
Next Steps
In Part 4: CI/CD and Monitoring with Prometheus & Grafana, we will dive into the operational side of the project:
- Automated Pipelines: Setting up CI/CD for both the .NET backend and Angular frontend.
- Infrastructure as Code: Containerizing the entire stack using Docker and Orchestration.
- Full-Stack Observability: Implementing Prometheus metrics and Grafana dashboards to monitor SignalR throughput, message latency, and system health.
Prepared by Burhan Sözer
Software & GIS Engineer*