Part 1: Building 3D Real-Time Asset Tracking Ecosystem
An end-to-end real-time asset tracking architecture built with .NET, RabbitMQ, SignalR, Angular, and CesiumJS — designed for high-frequency telemetry ingestion and 3D geospatial visualization.
🚀 Building 3D Real-Time Asset Tracking Ecosystem (Part 1)
Part 1: Architectural Foundations & System Design
The speed of geospatial data is now measured in milliseconds.
Monitoring the real-time location of a drone, the trajectory of a ship, or the movement of field personnel is no longer just a map feature — it is the heartbeat of modern operational systems.
In this blog series, I will explore the Critical Asset Tracking Platform, an end-to-end project I developed from scratch.
In this first installment, we focus on the overall system architecture, the technology stack, and the strategic reasoning behind these choices.
1. The Vision: Why Critical Asset Tracking?
Unlike standard fleet management systems, critical asset tracking demands:
- Ultra-low latency
- High data integrity
- Continuous real-time awareness
Key Requirements
Real-Time Awareness
Data must be visualized on the map the moment it is generated.Scalability
The system must handle simultaneous telemetry streams from hundreds of diverse sources.3D Visualization
For critical assets, X-Y coordinates are not enough.
Altitude, orientation, and environmental context are essential.
2. High-Level Architecture: The Three Pillars
The system is built on three loosely coupled pillars to ensure modularity, scalability, and fault tolerance.
I. The Simulator (Data Producer)
A high-performance .NET-based simulation engine that mimics real hardware (IoT devices, drones, or moving assets).
- Generates telemetry data in JSON format
- Supports high-frequency data production
- Designed to push the system to its operational limits
II. The Backend (The Brain)
The central intelligence layer that ingests, validates, and distributes data.
- Uses RabbitMQ as a message broker
- Buffers traffic bursts to avoid system overload
- Ensures reliable, ordered, and lossless data processing
III. The Frontend (The Command Center)
A sophisticated visualization layer built with:
- Angular
- CesiumJS
Responsibilities:
- Render real-time asset positions on a 3D globe
- Maintain smooth animations under high update frequency
- Provide operators with situational awareness
3. Technology Stack & Strategic Decisions
| Layer | Technology | Strategic Value |
|---|---|---|
| Backend | .NET (C#) | High-performance asynchronous processing and a robust ecosystem |
| Simulator | .NET (C#) | Efficient simulation of thousands of concurrent data points |
| Messaging | RabbitMQ | Decouples producers from consumers; ensures zero data loss |
| Real-Time | SignalR | WebSocket-based push communication for instant updates |
| GIS Engine | CesiumJS | The most powerful web-based 3D geospatial engine |
4. How the Data Flows (The Pipeline)
Generate
The Simulator produces telemetry data and publishes it to a RabbitMQ exchange.Process
The Backend consumes messages, validates payloads, and applies business rules.Broadcast
Processed telemetry is pushed to all connected clients via SignalR.Render
The Angular + Cesium application updates 3D asset models in real time.
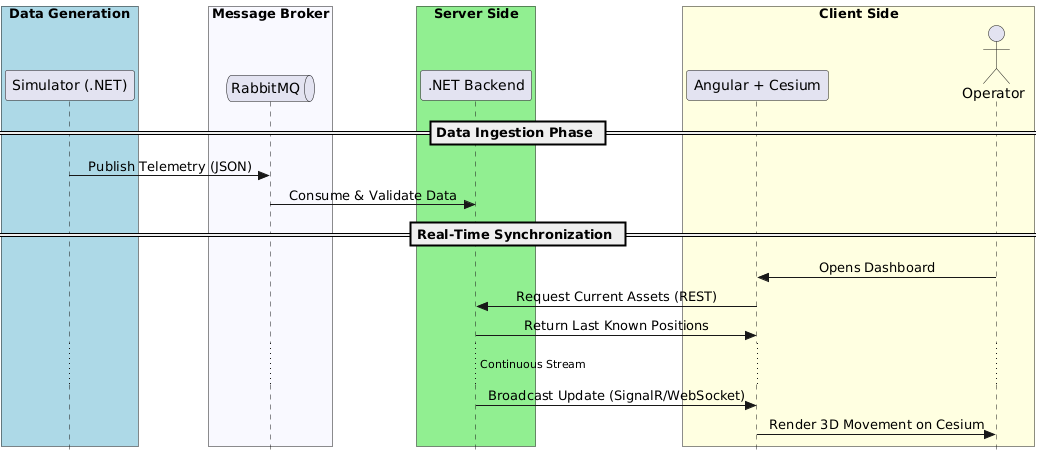
5. System Sequence Architecture
The following sequence diagram illustrates the interaction between all system components — from data ingestion to operator visualization.
6. Live Demo
Overview:
Filtering:

Prohibited Area (Geofence) & Alarming:
Prepared by Burhan Sözer
Software & GIS Engineer*