Part 2: Building a Real-Time Telemetry Pipeline (Backend & Simulator)
A deep dive into a production-ready real-time telemetry pipeline — from asset simulation and RabbitMQ messaging to CRC32 validation, SignalR streaming, and full observability with Prometheus and Grafana.

Real-Time Data Flow with Backend & Simulator
A technical deep dive into how telemetry data flows from the simulator through RabbitMQ, gets validated by the backend with integrity checks, and is broadcast to connected clients in real time.
🚀 Overview
This article focuses on the backend data pipeline and real-time streaming architecture of the Critical Asset Tracking Platform.
It complements the frontend-focused article on 3D maps and live dashboards by explaining how data is produced, transported, validated, and observed.
What You'll Learn
- Asset telemetry simulation (GPS, speed, heading)
- RabbitMQ-based message-driven architecture
- Lightweight integrity validation using CRC32
- Real-time data push with SignalR
- Health checks and resilience patterns
- Observability using Prometheus & Grafana
Who Should Read This
- Build real-time data pipelines with .NET
- Understand message broker patterns using RabbitMQ
- Implement data integrity checks in streaming systems
- Set up observability with health checks and Grafana dashboards
🧱 Architecture Overview
Real-time asset tracking requires a robust, decoupled architecture that can handle high-frequency telemetry updates with minimal latency and guaranteed integrity. The Critical Asset Tracking Platform demonstrates this through a well-designed microservices pattern.
Core Components
| Component | Responsibility |
|---|---|
| Simulator | Generates telemetry for multiple asset types |
| RabbitMQ | Reliable, decoupled message transport |
| Backend API | Validation, metrics, SignalR broadcasting |
| Frontend | Real-time visualization (Angular + Cesium) |
Why This Architecture?
- Loose coupling: Components can fail or restart independently.
- Message durability: RabbitMQ persists data; nothing gets lost.
- Scalability: Add more producers or consumers as needed.
- Integrity: CRC32 validation detects bit corruption and ensures message authenticity.
- Real-time delivery: SignalR streams updates with minimal latency.
- Observable: Health checks + Prometheus metrics out of the box.
Backend Project Structure: Clean Architecture
The backend follows Clean Architecture principles, separating concerns into distinct layers:
| Layer | Responsibility | Dependencies |
|---|---|---|
| Domain | Core business entities | None |
| Application | Use cases, interfaces, DTOs | Domain |
| Infrastructure | External integrations | Application |
| Api | HTTP/WebSocket endpoints | Application, Infrastructure |
Why this matters:
- Testability — Business logic has no external dependencies
- Flexibility — Swap RabbitMQ for Kafka without touching Application layer
- Maintainability — Clear boundaries between concerns
🔁 Achitectural Flow Diagram
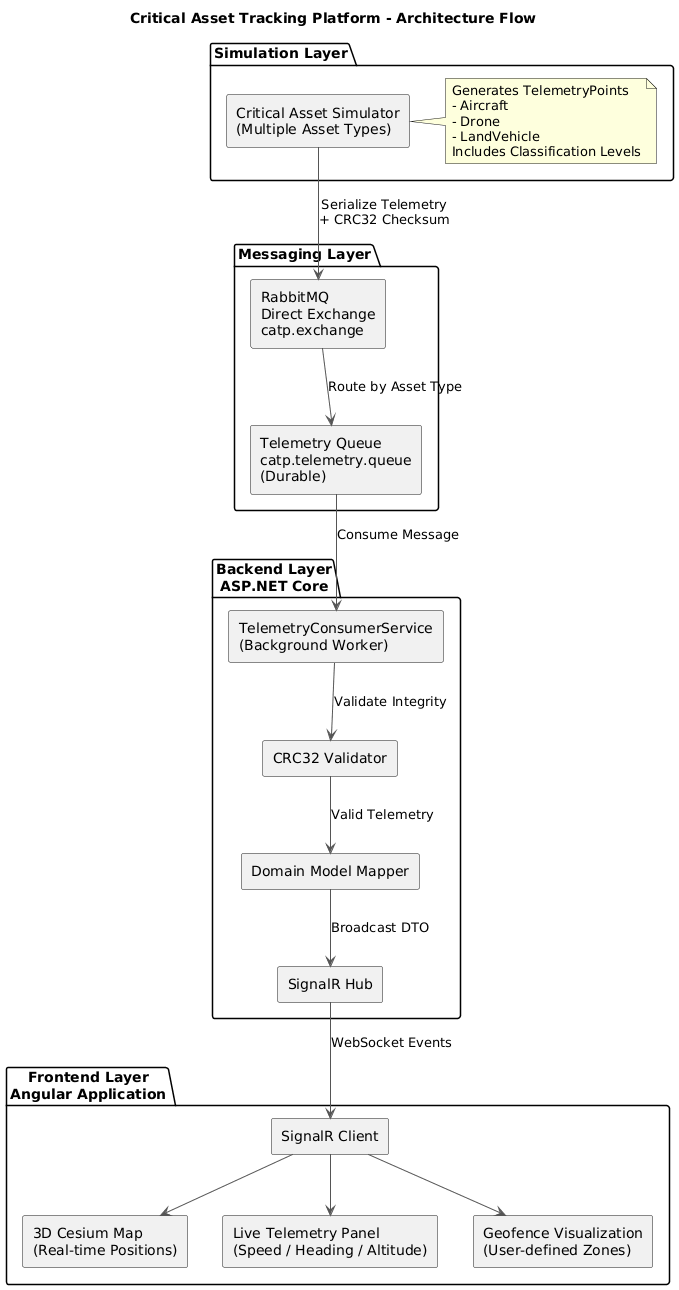
📦 Message Envelope
All messages follow a standard envelope with integrity validation:
{
  "message": {
    "header": {
      "protocol": "CATP/1.0",
      "messageType": "telemetry",
      "assetId": "DRONE-001",
      "timestampUtc": "2024-12-23T14:30:45.123Z",
      "classification": "UNCLASSIFIED",
      "assetType": "Drone"
    },
    "body": {
      "latitude": 39.9526,
      "longitude": -75.1652,
      "altitudeMeters": 150.0,
      "speedMetersPerSecond": 25.5,
      "headingDegrees": 270.0
    }
  },
  "integrity": {
    "checksum": "A7E3F2D1"
  }
}
Deep Dive: The Simulator
The simulator generates realistic GPS telemetry for multiple asset types and publishes them to RabbitMQ.
Configuration
Assets are defined in config.json:
{
  "simulation": {
    "assetCount": 5,
    "assetTypeCounts": {
      "Aircraft": 2,
      "Drone": 2,
      "LandVehicle": 1
    },
    "stepIntervalMs": 1000
  }
}
How Movement Works
- Each simulation step updates asset positions based on speed and heading:
public IEnumerable<TelemetryPoint> Step(int deltaTimeMs)
{
    foreach (var asset in _assets)
    {
        asset.Move(deltaTimeMs);  // Updates lat/lon
        yield return asset.CreateTelemetry();
    }
}- CRC32 Integrity
Before publishing, a checksum is computed over the serialized message:
var crc = new Crc32();
crc.Append(Encoding.UTF8.GetBytes(messageJson));
var checksum = BitConverter.ToString(crc.GetCurrentHash()).Replace("-", "");
// Returns: "A7E3F2D1"
🐰 Message Queue: RabbitMQ
RabbitMQ decouples the simulator from the backend, ensuring reliable message delivery.
| Component | Value |
|---|---|
| Exchange | catp.exchange (Direct) |
| Queue | catp.telemetry.queue (durable) |
| Routing Key | catp.telemetry.queue |
- Publishing Flow:
await _channel.BasicPublishAsync(
    exchange: "catp.exchange",
    routingKey: "catp.telemetry.queue",
    body: messageBytes,
    mandatory: true
);
Key benefits:
- Durability — Messages persist to disk
- Decoupling — Simulator and backend can restart independently
- Backpressure — Queue absorbs traffic spikes
⚙️ Backend: Consuming & Validating
The TelemetryConsumerHostedService runs as a background service, consuming messages from RabbitMQ.
- Validation Pipeline:
consumer.ReceivedAsync += async (_, ea) =>
{
    var rawJson = Encoding.UTF8.GetString(ea.Body.ToArray());

    // Extract exact "message" element for checksum validation
    using var doc = JsonDocument.Parse(rawJson);
    var messageRawText = doc.RootElement.GetProperty("message").GetRawText();

    // Validate CRC32
    var calculated = ChecksumCalculator.ComputeCrc32(messageRawText);
    var received = envelope.Integrity.Checksum;

    if (calculated != received)
    {
        _logger.LogWarning("CHECKSUM MISMATCH - dropping message");
        return;
    }

    // Valid → process and broadcast
    await _processor.ProcessAsync(envelope);
    await _channel.BasicAckAsync(ea.DeliveryTag, false);
};
🔐 Invalid checksums are logged and dropped — no corrupted data enters the system.
📡 Real-Time Broadcasting (SignalR)
After validation, telemetry is pushed to all connected clients via SignalR.
- Hub Setup:
public class TelemetryHub : Hub
{
    public override async Task OnConnectedAsync()
    {
        TelemetryMetrics.ActiveSignalRConnections.Inc();
        await base.OnConnectedAsync();
    }
}- Publishing:
public class SignalRTelemetryPublisher : ITelemetryPublisher
{
    public async Task PublishAsync(TelemetryEnvelope envelope)
    {
        await _hubContext.Clients.All.SendAsync("ReceiveTelemetry", envelope);
    }
}
🩺 Health Checks
The API exposes multiple health endpoints for monitoring system status.
| Endpoint | Purpose |
|---|---|
| /health/live | Basic liveness — is the app running? |
| /health/ready | Readiness — are dependencies healthy? |
| /health | Detailed status with all checks |
Built-in Checks
- RabbitMQ Health:
builder.Services.AddHealthChecks()
    .AddRabbitMQ(/* connection factory */, name: "rabbitmq")
.AddCheck<TelemetryStreamHealthCheck>("simulator");- Simulator (Telemetry Stream) Health:
public class TelemetryStreamHealthCheck : IHealthCheck
{
    private static DateTime _lastMessageReceived;
    private readonly TimeSpan _unhealthyThreshold = TimeSpan.FromSeconds(30);

    public Task<HealthCheckResult> CheckHealthAsync(...)
    {
        var elapsed = DateTime.UtcNow - _lastMessageReceived;

        if (elapsed > _unhealthyThreshold)
            return Task.FromResult(HealthCheckResult.Unhealthy(
                $"No telemetry for {elapsed.TotalSeconds}s"));

        return Task.FromResult(HealthCheckResult.Healthy());
    }
}
Sample Response
{
"status": "Healthy",
"timestamp": "2024-12-23T14:30:00Z",
"signalRConnections": 5,
"checks": [
{ "name": "rabbitmq", "status": "Healthy", "duration": "12ms" },
{ "name": "simulator", "status": "Healthy", "description": "1250 messages received" }
]
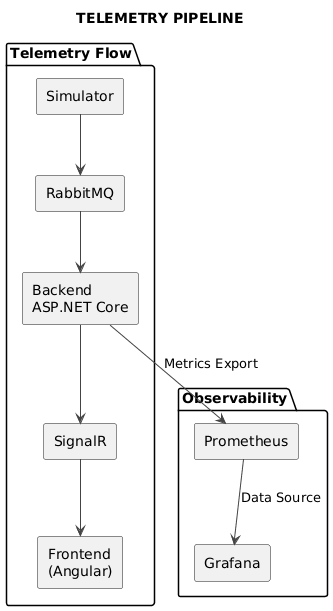
}📊 Observability: Prometheus & Grafana
The system exposes Prometheus metrics and includes pre-configured Grafana dashboards.
Prometheus Metrics
public static class TelemetryMetrics
{
    public static readonly Counter TelemetryMessagesProcessed = Metrics
        .CreateCounter("catp_telemetry_messages_processed_total",
            "Total messages processed", new[] { "asset_type", "status" });

    public static readonly Histogram TelemetryProcessingDuration = Metrics
        .CreateHistogram("catp_telemetry_processing_duration_seconds",
            "Processing duration", new[] { "asset_type" });

    public static readonly Counter ChecksumValidationFailures = Metrics
        .CreateCounter("catp_checksum_validation_failures_total",
            "Checksum failures", new[] { "asset_id" });

    public static readonly Gauge ActiveSignalRConnections = Metrics
        .CreateGauge("catp_signalr_connections_active",
            "Active SignalR connections");
}
Metrics are exposed at /metrics endpoint:
Docker Compose Stack
prometheus:
  image: prom/prometheus:latest
  ports:
    - "9090:9090"
  volumes:
    - ./Infrastructure/Monitoring/Metrics/Prometheus/prometheus.yml:/etc/prometheus/prometheus.yml

grafana:
  image: grafana/grafana:latest
  ports:
    - "3000:3000"
  volumes:
    - ./Infrastructure/Monitoring/Dashboards/Grafana/dashboards:/var/lib/grafana/dashboards
Prometheus Config
scrape_configs:
  - job_name: 'catp-api'
    static_configs:
      - targets: ['catp-api:80']
    metrics_path: /metrics
    scrape_interval: 5s
What You Can Monitor
| Metric | Insight |
|---|---|
| catp_telemetry_messages_processed_total | Throughput by asset type |
| catp_telemetry_processing_duration_seconds | Processing latency |
| catp_checksum_validation_failures_total | Security / integrity issues |
| catp_signalr_connections_active | Connected clients |
Grafana Dashboard:
Pre-configured dashboard available at:
http://localhost:3000
- Messages per second (grouped by asset type)
- Processing latency (histogram)
- Active SignalR connections (gauge)
- Checksum validation failures (alert rules)
End-to-End Flow Summary
| Step | Time | Action |
|---|---|---|
| 1 | 0ms | Simulator generates telemetry |
| 2 | 10ms | CRC32 computed, message published to RabbitMQ |
| 3 | 20ms | RabbitMQ routes to queue |
| 4 | 30ms | Backend consumes, validates checksum |
| 5 | 40ms | Metrics recorded, SignalR broadcasts |
| 6 | 50ms | Frontend receives update |
Conclusion
We built a production-ready real-time telemetry pipeline with:
- ✅ Simulator — Multi-asset GPS generation with classification levels
- ✅ RabbitMQ — Reliable, persistent message delivery
- ✅ CRC32 Validation — Lightweight integrity checks (CRC32 is used for fast corruption detection, not for cryptographic security. In production, this could be replaced with HMAC or digital signatures.)
- ✅ SignalR — Real-time push
- ✅ Health Checks — RabbitMQ and telemetry stream monitoring
- ✅ Prometheus + Grafana — Full observability stack
Next up: We'll explore the Angular + Cesium.js frontend — rendering assets on a 3D globe, drawing geofences, and handling real-time updates.
Prepared by Burhan Sözer
Software & GIS Engineer*