Part 4: CI/CD and Monitoring with Prometheus & Grafana
Automate your workflow with GitHub Actions and gain deep system insights. Learn to configure CI/CD pipelines for .NET/Angular and build real-time monitoring dashboards with Prometheus and Grafana.
Part 4: CI/CD and Monitoring with Prometheus & Grafana
Introduction
In this part, we will set up automated workflows for testing and deployment, plus add monitoring to watch our system's health. We'll use GitHub Actions for CI/CD and Prometheus & Grafana for monitoring.
CI Pipeline (Continuous Integration)
The CI pipeline runs automatically when we push code or create a pull request. It checks that everything builds and tests pass before merging.
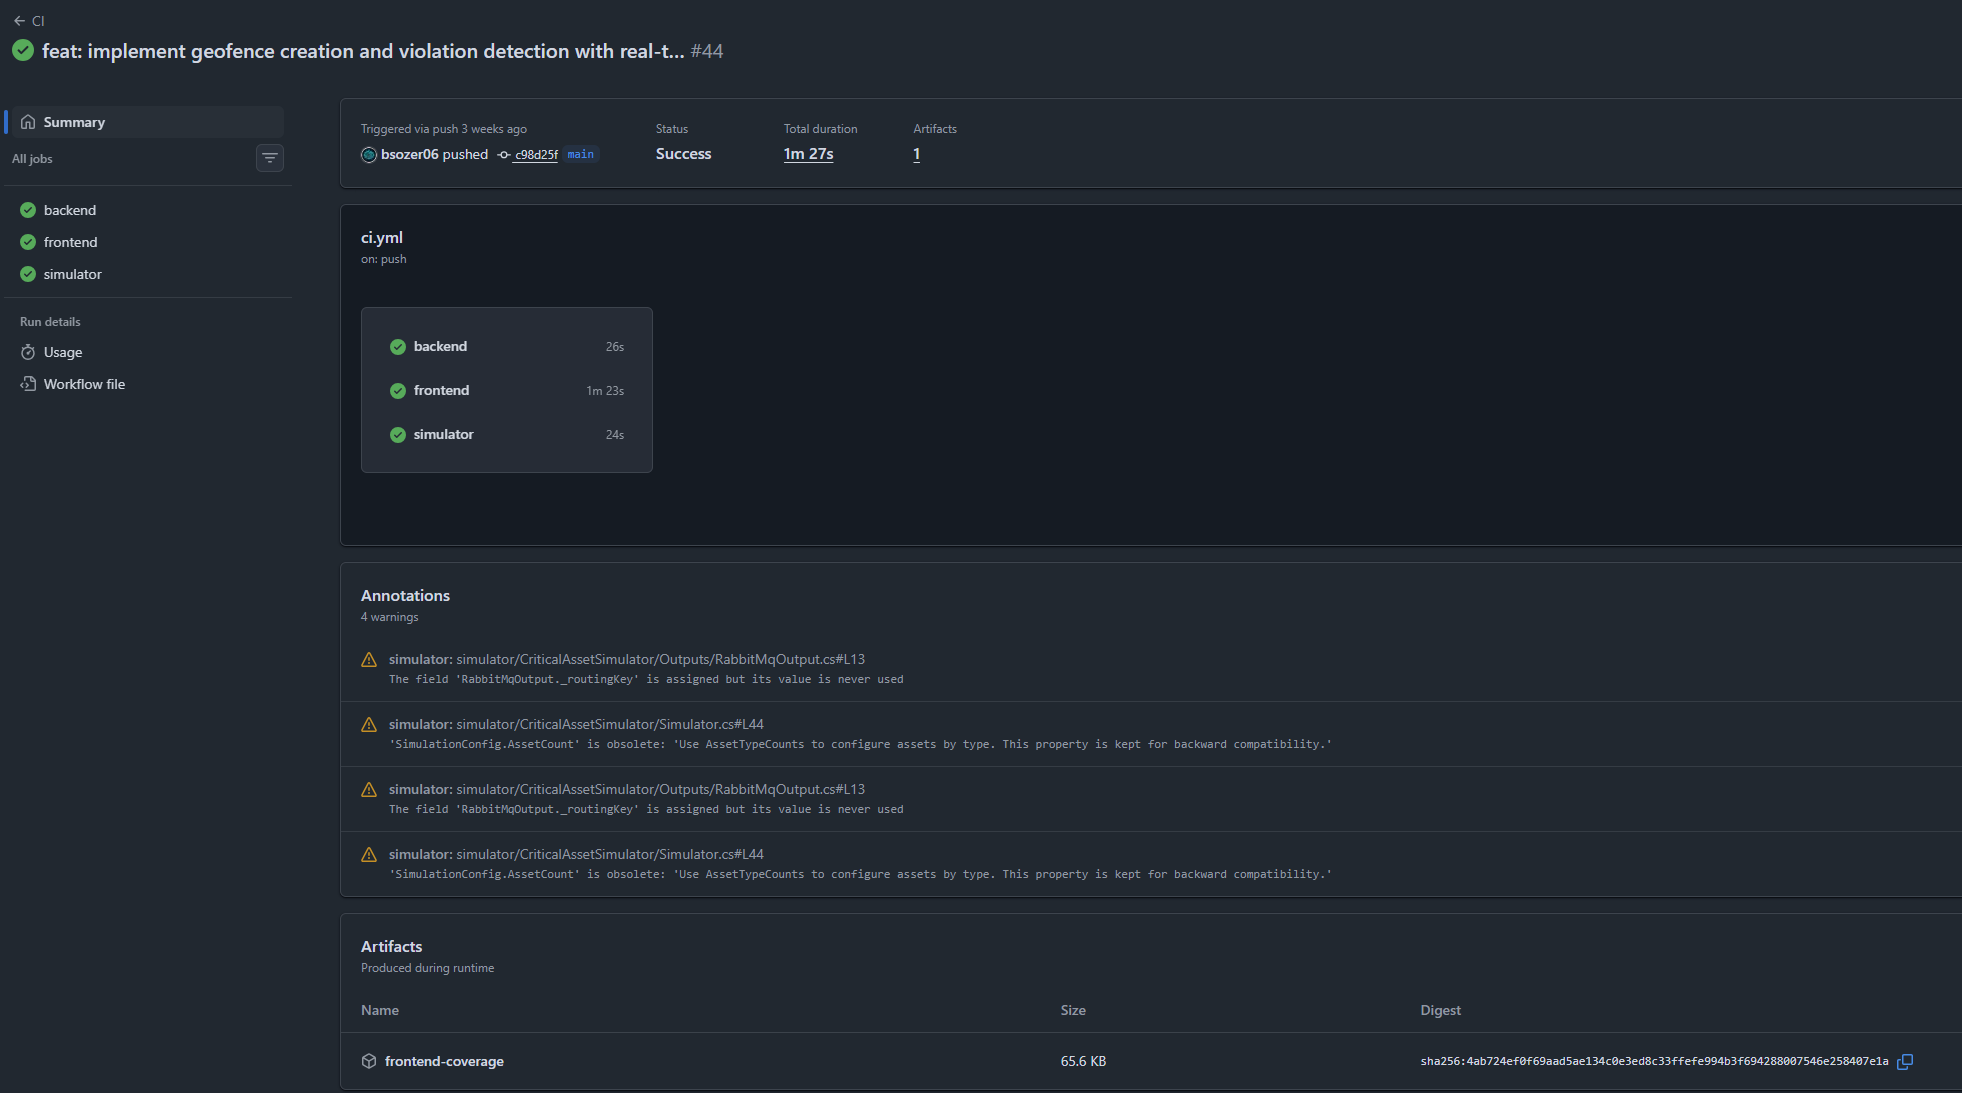
CI Workflow Structure
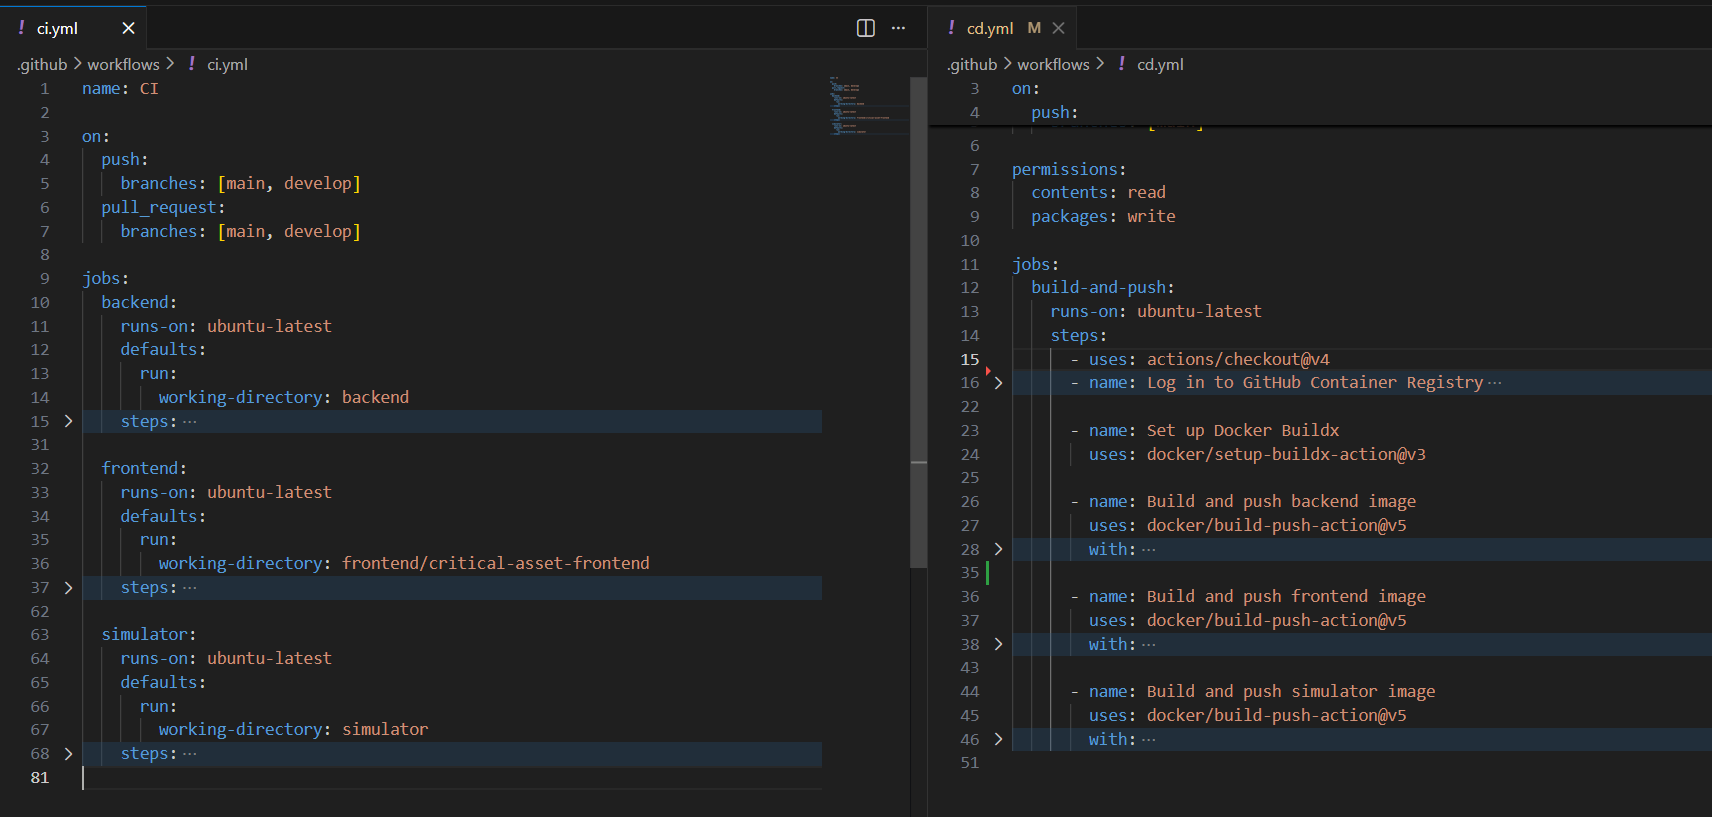
Our .github/workflows/ci.yml file has three jobs: backend, frontend, and simulator.
name: CI

on:
  push:
    branches: [main, develop]
  pull_request:
    branches: [main, develop]
This triggers the pipeline on pushes and pull requests to main and develop branches.
Backend Job
The backend job builds and tests our .NET API:
backend:
  runs-on: ubuntu-latest
  defaults:
    run:
      working-directory: backend
  steps:
    - uses: actions/checkout@v4

    - name: Setup .NET
      uses: actions/setup-dotnet@v4
      with:
        dotnet-version: '9.0.x'

    - name: Restore
      run: dotnet restore

    - name: Build
      run: dotnet build --no-restore --configuration Release

    - name: Test
      run: dotnet test --no-build --configuration Release
Steps:
- Checkout - Get the code from the repository
- Setup .NET - Install .NET 9.0
- Restore - Download dependencies
- Build - Compile the code
- Test - Run unit tests
Frontend Job
The frontend job checks our Angular application:
frontend:
  runs-on: ubuntu-latest
  defaults:
    run:
      working-directory: frontend/critical-asset-frontend
  steps:
    - uses: actions/checkout@v4

    - name: Setup Node.js
      uses: actions/setup-node@v4
      with:
        node-version: '20.x'

    - name: Install dependencies
      run: npm ci

    - name: Lint
      run: npm run lint

    - name: Build
      run: npm run build

    - name: Test & Coverage
      run: npm run test:coverage

    - name: Upload coverage artifact
      uses: actions/upload-artifact@v4
      with:
        name: frontend-coverage
        path: frontend/critical-asset-frontend/coverage/
Steps:
- Setup Node.js - Install Node.js 20.x
- Install - Download npm packages
- Lint - Check code style
- Build - Compile the Angular app
- Test - Run tests and generate coverage report
- Upload - Save coverage report as artifact
Simulator Job
Similar to backend, the simulator job builds our telemetry simulator.
CD Pipeline (Continuous Deployment)
The CD pipeline builds Docker images and pushes them to GitHub Container Registry when code is merged to main.

CD Workflow
Our .github/workflows/cd.yml creates and publishes Docker images:
name: CD

on:
  push:
    branches: [main]

permissions:
  contents: read
  packages: write
This only runs on main branch pushes, not on every branch.
Docker Build Steps
- name: Log in to GitHub Container Registry
  uses: docker/login-action@v3
  with:
    registry: ghcr.io
    username: ${{ github.actor }}
    password: ${{ secrets.GITHUB_TOKEN }}

- name: Set up Docker Buildx
  uses: docker/setup-buildx-action@v3

- name: Build and push backend image
  uses: docker/build-push-action@v5
  with:
    context: ./backend
    file: backend/Api/Dockerfile
    push: true
    tags: |
      ghcr.io/${{ github.repository }}/backend:latest
      ghcr.io/${{ github.repository }}/backend:${{ github.sha }}
For each service (backend, frontend, simulator):
- Login - Authenticate with container registry
- Build - Create Docker image
- Tag - Add tags (
latestand commit SHA) - Push - Upload to registry
This gives us versioned images we can deploy anywhere.
Monitoring with Prometheus
Prometheus collects metrics from our API to track system performance.
Prometheus Configuration
Our prometheus.yml tells Prometheus where to find metrics:
global:
  scrape_interval: 15s
  evaluation_interval: 15s

scrape_configs:
  - job_name: 'catp-api'
    static_configs:
      - targets: ['catp-api:80']
    metrics_path: /metrics
    scrape_interval: 5s
Settings:
- scrape_interval: How often to collect metrics (every 5 seconds for our API)
- job_name: Name for this metrics source
- targets: Where to find the API (our Docker container)
- metrics_path: API endpoint that exposes metrics
Application Metrics
We track four key metrics in our application:
// Total messages processed
Counter TelemetryMessagesProcessed = Metrics
    .CreateCounter("catp_telemetry_messages_processed_total",
        "Total number of telemetry messages processed",
        new[] { "asset_type", "status" });

// Processing time
Histogram TelemetryProcessingDuration = Metrics
    .CreateHistogram("catp_telemetry_processing_duration_seconds",
        "Duration of telemetry message processing",
        new[] { "asset_type" });

// Validation errors
Counter ChecksumValidationFailures = Metrics
    .CreateCounter("catp_checksum_validation_failures_total",
        "Total number of checksum validation failures",
        new[] { "asset_id", "asset_type" });

// Active connections
Gauge ActiveSignalRConnections = Metrics
    .CreateGauge("catp_signalr_connections_active",
        "Current number of active SignalR connections");
These metrics help us answer:
- How many messages are we processing?
- How fast are we processing them?
- Are there validation errors?
- How many clients are connected?
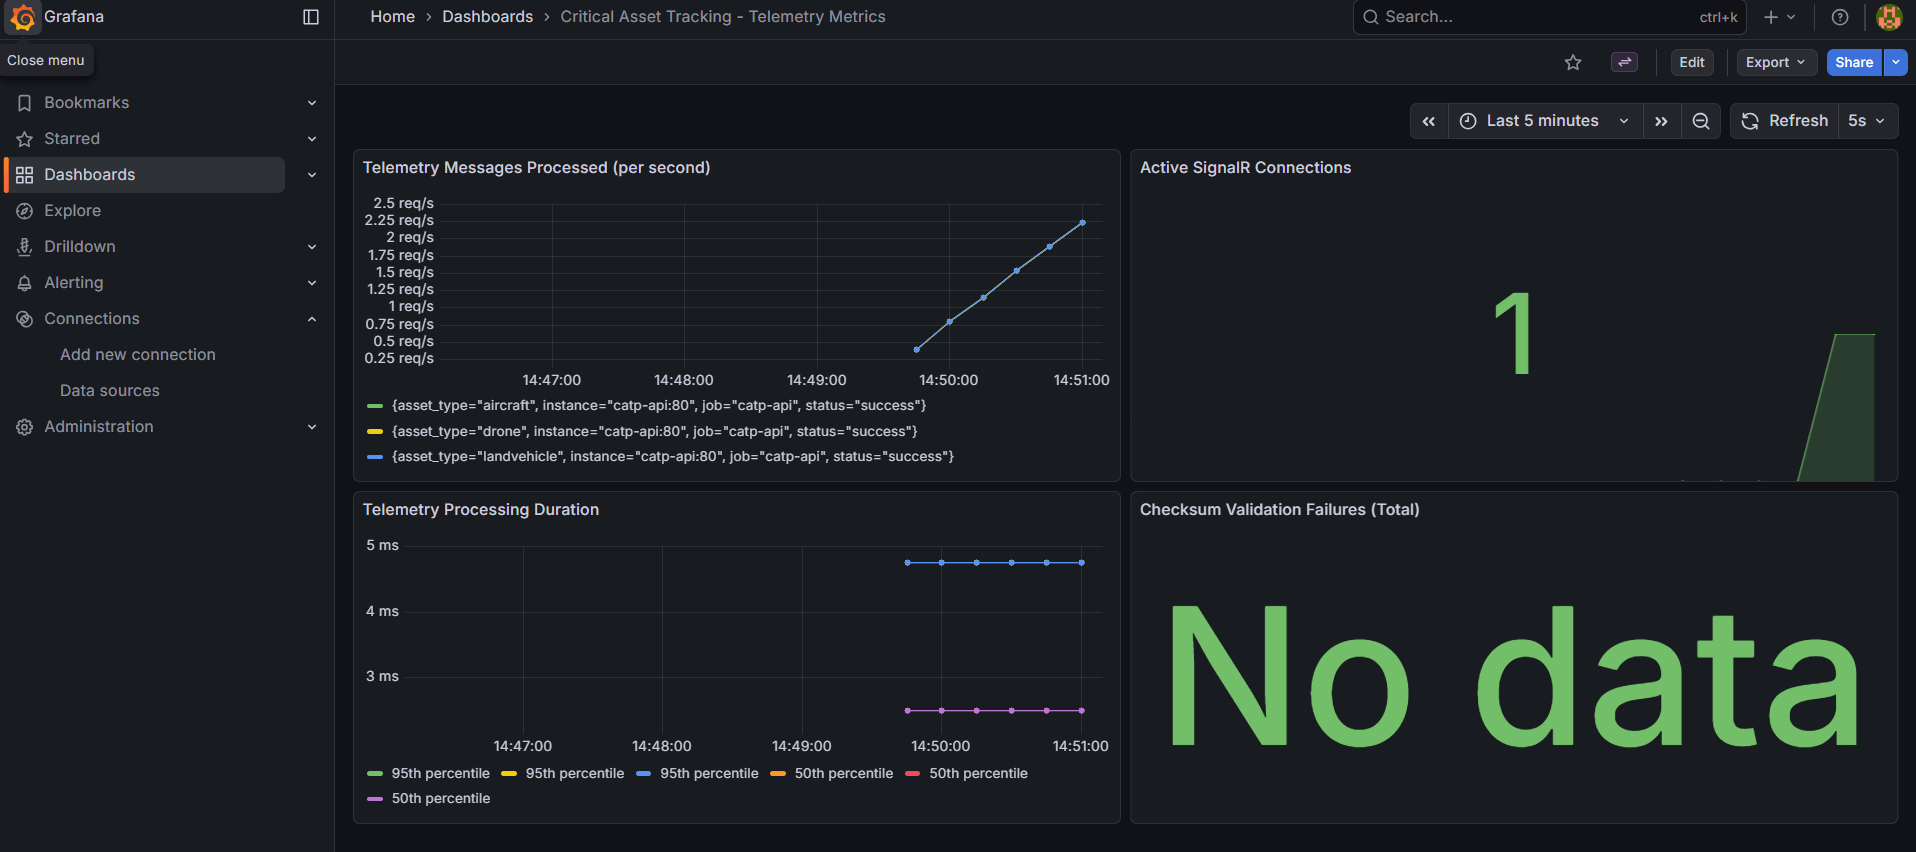
Visualization with Grafana
Grafana creates visual dashboards from Prometheus metrics.
Grafana Setup
The datasources/prometheus.yml connects Grafana to Prometheus:
apiVersion: 1

datasources:
  - name: Prometheus
    type: prometheus
    url: http://catp-prometheus:9090
    access: proxy
    isDefault: true
    editable: true
This tells Grafana where to get data from.
Dashboard
We have a pre-built dashboard in catp-telemetry.json that shows:
- Messages processed over time
- Processing duration trends
- Checksum validation failures
- Active SignalR connections
- System health metrics
Docker Compose Integration
In our docker-compose.yml, we add Prometheus and Grafana:
prometheus:
  image: prom/prometheus:latest
  container_name: catp-prometheus
  ports:
    - "9090:9090"
  volumes:
    - ./Infrastructure/Monitoring/Metrics/Prometheus/prometheus.yml:/etc/prometheus/prometheus.yml
  depends_on:
    - api

grafana:
  image: grafana/grafana:latest
  container_name: catp-grafana
  ports:
    - "3000:3000"
  environment:
    GF_SECURITY_ADMIN_PASSWORD: admin
  volumes:
    - ./Infrastructure/Monitoring/Dashboards/Grafana/provisioning:/etc/grafana/provisioning
    - ./Infrastructure/Monitoring/Dashboards/Grafana/dashboards:/var/lib/grafana/dashboards
  depends_on:
    - prometheus
Accessing the Monitoring Stack
After running docker-compose up:
- Grafana Dashboard: http://localhost:3000 (username:
admin, password:admin) - Prometheus UI: http://localhost:9090
- API Metrics Endpoint: http://localhost:5073/metrics
Summary
We now have:
- CI Pipeline - Automatically tests code on every push
- CD Pipeline - Builds and publishes Docker images on merge to main
- Prometheus - Collects metrics from our API every 5 seconds
- Grafana - Shows visual dashboards of system health
This setup helps us:
- Catch bugs early with automated testing
- Deploy consistently with Docker images
- Monitor system performance in real-time
- Debug issues with historical metrics data
The combination of CI/CD and monitoring gives us confidence to deploy frequently while maintaining system reliability.
Prepared by Burhan Sözer
Software & GIS Engineer